
Proven Checks Buyers Miss In A Batch Manufacturing Record
The first commercial batch from a new intermediate supplier is not a formality. Here is the checklist, the five approval outcomes, and how to log the call.
Table of Contents
A procurement manager at an Indian formulation plant once told me he had “a good supplier” for a key intermediate. When I asked what made the supplier good, the answer was an audit from 18 months earlier and a feeling that shipments were fine.
Nobody had looked at the numbers. When we finally pulled them together, the picture was uncomfortable: one batch in nine had arrived with a COA discrepancy, delivery reliability had slid from 96% to 81% over four quarters, and three technical queries had sat unanswered for over two weeks. Nothing had failed loudly. The supplier was simply drifting — and nobody was watching.
This is the gap a supplier scorecard exists to close. The qualification work you did before the first purchase order — the five-step supplier evaluation, the effort to verify the supplier’s compliance claims, the site audit — answers one question at one point in time. A scorecard answers a different question, continuously: is the supplier you approved still performing like the supplier you approved?
Approved supplier status is easy to treat as permanent. It is not. ICH Q10 expects companies to manage outsourced materials and activities across the whole relationship, and EU GMP Chapter 7 is explicit that contract performance should be reviewed on an ongoing basis — not just at onboarding.
Regulators phrase it as an expectation for licensed manufacturers, but the logic applies to anyone buying intermediates that end up in a registered product: your supplier’s process is part of your supply chain, whether or not the contract says so.
Between audits, a lot can change. Key personnel leave. A step is quietly re-optimized and the impurity profile shifts within spec. Demand from another customer squeezes your capacity slot. None of this shows up in a certificate that still says 99.2%.
A scorecard catches the pattern; the formal change-notice call is what turns the pattern into a documented decision that survives the next audit.
A supplier scorecard is the least expensive instrument for noticing these changes while they are still small — the data already exists in your inbox, your ERP, and your QC lab. It just isn’t in one place.
Keep the scorecard small enough that someone actually maintains it. Five groups cover what matters when the product is a pharmaceutical intermediate:
| Group | Core metric | Where the data lives | Warning sign |
|---|---|---|---|
| Quality | First-pass acceptance rate; COA verification discrepancy rate | Receiving records; your QC verification results | Acceptance below ~97%; repeated small assay gaps between your lab and theirs |
| Delivery | OTIF (on time, in full) | PO dates vs. arrival; packing list vs. order | Below 95%; partial shipments becoming normal |
| Responsiveness | Quote turnaround; technical query response time | Email timestamps | Quotes taking >5 working days; questions answered by sales, never by technical staff |
| Documentation | COA completeness and accuracy; changes notified before shipment | Receiving checklist | COAs missing retest dates; process or site changes discovered after arrival |
| Commercial | Price stability; willingness to hold terms | PO history | Unannounced price revisions; sudden pressure to change payment terms |
Two notes from experience. First, the COA discrepancy rate is the most revealing number in the table. You do not need full retesting of every batch to generate it — the habit of reading the COA critically at receiving, plus periodic verification against your own lab, is enough.
A supplier whose certificates routinely differ from your results by more than method variation has a problem, and it will show here long before a batch fails outright. If you have ever caught a fabricated-looking certificate, the COA verification checks deserve a permanent line in your scorecard input.
Second, measure documentation as a separate group, not as part of quality. A batch can pass every test and still come with paperwork that would not survive an inspection — that is a supplier-system weakness, and it predicts future trouble that today’s assay result cannot.
Third, score responsiveness against the expectations you set in your intermediate RFQ. If you never stated a turnaround requirement, the metric has no baseline and the supplier has no fair target to hit.
Numbers only become a scorecard when they are weighted. The exact weights matter less than the discipline of setting them before you look at the data. A starting point that has worked for mid-size buyers:
| Group | Weight | Why |
|---|---|---|
| Quality | 40 | A rejected batch costs more than every other failure mode combined |
| Delivery | 25 | Late material stalls production schedules and forces firefighting |
| Documentation | 15 | Invisible today, expensive during an inspection or specification defense |
| Responsiveness | 15 | Predicts how a supplier behaves when something goes wrong |
| Commercial | 5 | Worth tracking, but should never rescue a weak quality score |
Set three bands and write down what each one triggers, before the first review meeting: 85 and above, keep buying normally; 70–84, watch list — ask questions, request a corrective plan for any group that slid; below 70, escalate formally. The bands are what turn a spreadsheet into a decision tool. Without them, every quarterly review becomes an argument about whether 78 is “really that bad.”
The workflow that survives real workload is boring on purpose:
Direction matters more than any single score because quality itself is a trend phenomenon. A supplier’s real consistency shows up in batch-to-batch data, and your scorecard is simply your own copy of that trend, built from the shipments you actually received.
A scorecard that changes nothing is decoration. Every band must map to an action:
Notice the pattern: the scorecard’s purpose is not to punish suppliers. It is to make every conversation factual. “Your OTIF fell from 96 to 84 over three quarters” ends debates that “we feel your service has gotten worse” starts.
Fix these before adding metrics. A five-line scorecard maintained for three years beats a thirty-line one abandoned in a quarter.
Evaluation is the gate before the first order: capabilities, quality systems, documentation, site visit. The scorecard is the record after orders begin: acceptance rates, delivery, responsiveness, documentation accuracy, trend over time. You need both, and they use different data — one comes mostly from the supplier, the other almost entirely from your own receiving and QC records.
First-pass acceptance rate, COA verification discrepancy rate, and OTIF. These three predict most of the pain buyers actually experience. Responsiveness is the best early indicator of how a supplier will behave during a problem, which is why it earns its own weight rather than being folded into service quality.
Capture data on every batch — it takes minutes. Review formally each quarter, and let the annual review drive requalification depth. Quarterly is frequent enough to catch drift before it becomes a failed batch, and infrequent enough that the numbers represent a real trend instead of noise from two shipments.
When a supplier drops below 70, or stays in the watch band for two consecutive quarters despite a corrective plan. Qualifying a second source takes months, so the trigger must fire while the primary supplier is still functional — a scorecard is what buys you that lead time.
You already collect most of the data a supplier scorecard needs. Turning it into five weighted numbers, reviewed four times a year, converts supplier management from memory and instinct into something you can defend — to your quality team, to an auditor, and to the supplier whose performance has quietly slipped. Buyers who run scorecards also buy better: they know which suppliers earned their volumes and which are coasting on an audit from two years ago.
We manufacture pharmaceutical intermediates for buyers across India, Bangladesh, and Pakistan, and we would rather be measured than guessed at. Ask us for the batch documentation behind our performance claims — COA history, verification results, and delivery records — and score us the way this article recommends.
The first commercial batch from a new intermediate supplier is not a formality. Here is the checklist, the five approval outcomes, and how to log the call.

The first commercial batch from a new intermediate supplier is not a formality. Here is the checklist, the five approval outcomes, and how to log the call.
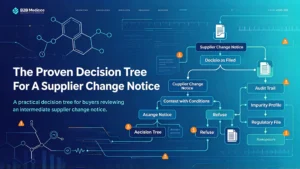
A buyer-side decision tree for handling an intermediate supplier change notice — what to accept, contest, or reject, and how to log the call.

Manufacturer and supplier of pharmaceutical APIs and intermediates. Contact us for technical support and sourcing solutions.