
How to Read a COA for Pharmaceutical Intermediates: What “99% Purity” Really Means
Learn how to read a pharmaceutical intermediate COA — assay vs. purity, red flags, and a checklist that catches what suppliers leave out.
Table of Contents
If you buy pharmaceutical intermediates, you’ve seen the number. 99% purity. It’s on every COA, every product page, every supplier email. It looks reassuring. It sounds like quality.
Here’s the problem: a lot of what you think that number means is wrong.
I’m not saying suppliers are lying. Most aren’t. But the gap between what a COA says and what it actually tells you about the material you’re buying — that gap is real, and it’s where expensive sourcing mistakes happen.
This guide walks through what a Certificate of Analysis actually contains, how to read one without getting fooled by surface-level numbers, and which red flags matter more than the purity percentage.
A Certificate of Analysis is a batch-specific document issued by the manufacturer’s quality control lab. It lists the tests performed on that specific production batch, the acceptance criteria for each test, and the actual results obtained.
Think of it as a birth certificate for a batch of intermediate. It says: this is what we made, this is how we tested it, and here’s what we found.
What it is not:
A COA tells you what the supplier measured. Whether that measurement tells the full story is a different question.
A proper COA for a pharmaceutical intermediate should contain, at minimum, these sections. If any are missing, that’s your first red flag.
Section | What to Look For |
Product Identification | Full chemical name, CAS number, batch/lot number, manufacturing date, retest date |
Test Parameters | Appearance, identification (IR/NMR), assay, purity/impurity profile, residual solvents, water content (Karl Fischer), heavy metals, residue on ignition |
Specifications (Acceptance Criteria) | The numerical limits for each parameter — e.g., “Assay: 98.0%–102.0%” |
Actual Results | The measured values for this batch, side-by-side with specifications |
Test Methods | Which analytical method was used for each parameter — HPLC, GC, titration, etc. |
Certification Statement | A declaration that the batch conforms to the stated specifications |
Signatures | Signed by QC analyst and QA approver, with dates |
A COA with test results but no method references is incomplete. A COA with methods but no specification limits is useless. You need both to judge what you’re looking at.
Let’s get into the part that trips up most buyers.
When a COA says “Purity: 99.2% (HPLC),” here’s what most people think:
“99.2% of this material is the compound I ordered.”
Here’s what it usually actually means:
“Of the peaks the HPLC detector could see under this specific method, 99.2% of the total area belongs to the main peak.”
These are not the same thing. Not even close.
Most “HPLC purity” numbers on intermediate COAs come from a calculation called area normalization. The instrument integrates all detected peaks, adds up their areas, and reports the main peak’s area as a percentage of the total.
The problem? This method is blind to anything the detector can’t see:
So a material could be 99% pure by HPLC area normalization, but actually contain 5% water, 2% inorganic salt, and only 92% of the compound you ordered. The COA wouldn’t lie — it just wouldn’t tell you the whole story.
This is the part that catches people off guard. I’ve seen experienced procurement managers mix these up.
Parameter | What It Measures | What It Misses |
HPLC Purity (area%) | Ratio of main peak to total detected peaks | Everything the detector can’t see |
Assay (wt%) | Actual weight-percentage of the target compound against a reference standard | Nothing — it’s the real number |
An assay uses a certified reference standard to quantify how much of the target compound is actually present. It answers the question: “If I weigh out 100 mg of this material, how many mg are the compound I want?”
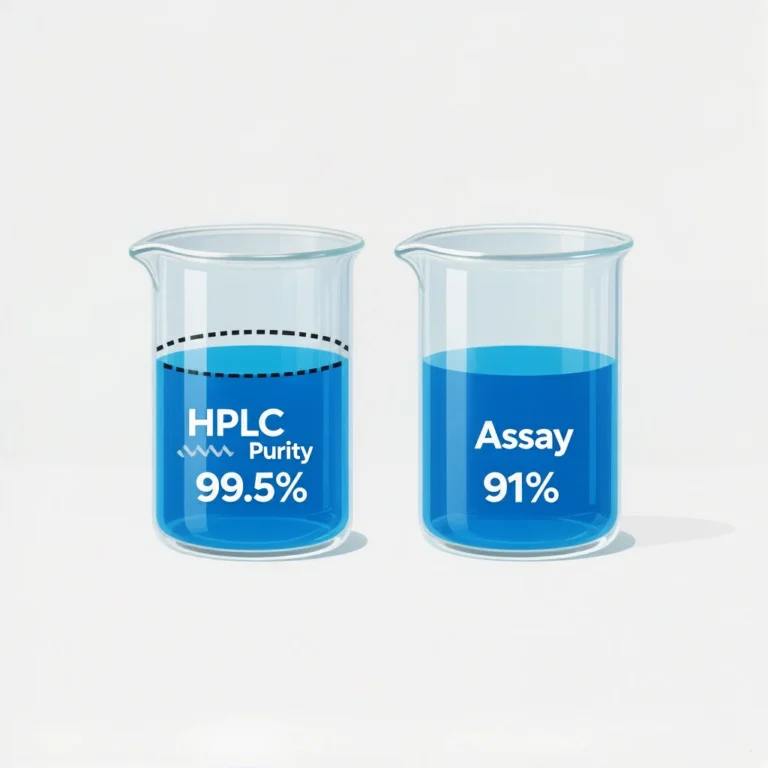
HPLC purity answers a different question: “Among the things the detector noticed, how dominant is the main peak?”
These two numbers can differ by 5–10 percentage points for the same batch. A material that’s 99.5% pure by HPLC could be 91% by assay. If you’re formulating based on the 99.5% number, your stoichiometry is off, and your downstream yield suffers.
ICH Q3C classifies solvents into three categories. If your intermediate was made using Class 1 solvents (benzene, carbon tetrachloride) or Class 2 solvents above permitted daily exposure limits, the COA should flag this explicitly. A COA with no residual solvent data at all is incomplete.
Water is the silent purity killer. A material stored improperly can pick up several percent moisture that won’t show up in an HPLC trace. Always check for a Karl Fischer result. If it’s missing, ask why.
If your intermediate is chiral — and many pharmaceutical intermediates are — the COA should include enantiomeric excess (ee%) or chiral purity data. A racemic impurity won’t separate on a standard achiral HPLC column, so a “99% purity” result could hide 50% of the wrong enantiomer. This matters enormously for bioactivity.
USP <231> or ICH Q3D elemental impurity limits apply. For intermediates destined for chronic-use drugs, the Class 1 and Class 2A elemental impurity limits are tight. If the COA has no heavy metals testing, that’s a gap.
Beyond the numbers, a COA reveals a lot about the manufacturer’s quality culture. Here’s what should make you pause:
Red Flag | Why It Matters |
No method references | You can’t verify whether the right test was done |
All results at the spec limit | Real data has variation; results perfectly hitting limits suggests data manipulation |
Same values across multiple batches | Natural batch-to-batch variation is normal — identical numbers across batches is not |
Missing parameters (no residual solvents, no water, no heavy metals) | Either they didn’t test, or they tested and didn’t like the results |
No signature or electronic approval | A COA without traceable approval is just a piece of paper |
“Typical” values instead of batch-specific results | A COA should reflect the batch you’re buying, not an idealized average |
Handwritten numbers without supporting raw data | In 2026, QC data comes from instruments with audit trails — handwritten-only COAs are a compliance risk |
Next time a supplier sends you a COA, run through these six things. Takes five minutes. Could save you a rejected shipment — or worse, a batch that passes incoming QC but fails downstream because nobody caught what was missing.
If both assay and HPLC purity are reported, look at the gap. A gap of more than 2–3 percentage points between assay and HPLC purity means there’s significant non-UV-absorbing material in the batch. That’s not necessarily a dealbreaker — but you need to know about it.
Don’t just look at total impurities. Look at individual specified impurities. A 0.8% unknown impurity that’s structurally similar to your target compound might be harder to purge downstream than 2% of an inorganic salt.
If the COA is missing residual solvents, water content, or heavy metals — ask for the data. If the supplier can’t or won’t provide it, that’s information in itself.
According to FDA warning letter data, inadequate specifications and incomplete COA documentation rank among the most frequently cited GMP deficiencies for API and intermediate manufacturers.
Between 2020 and 2025, roughly one in five FDA warning letters to foreign API facilities cited issues with analytical data integrity — including COAs that didn’t reflect actual testing performed.
The European Directorate for the Quality of Medicines (EDQM) has similarly flagged incomplete impurity profiles on CEP applications as a leading cause of deficiency letters. In many cases, the issue wasn’t that the material was bad — it was that the COA didn’t tell the full story.
For buyers, here’s the bottom line: the COA you receive is only as good as the quality system behind it.
Here’s the practical takeaway, in plain English:
Stop treating “99% purity” as a quality metric. It’s a data point — and a narrow one. Start asking for the full analytical package: assay, impurity profile, residual solvents, water content, and chiral purity where relevant.
When comparing suppliers, compare the completeness of their documentation, not just the headline number. A supplier who provides a thorough COA with method details, batch-specific data, and full impurity characterization is telling you something about how they run their quality system.
A supplier who sends a one-page document with “Purity: 99%” and nothing else is also telling you something — just not what they think.
The best sourcing decision isn’t the one with the highest purity on paper. It’s the one where you actually know what’s in the drum.
A COA is not a quality certificate. It’s a data report. Whether that data tells you the truth depends on the supplier who generated it — and on whether you know what to look for.
Three things to remember:
Next step: Once you know how to read the numbers, the next question is whether the document itself is real. We’ve covered that in a separate guide — how to spot a fake Certificate of Analysis and the verification tools that actually work.
If you’re sourcing pharmaceutical intermediates and want to talk through what to look for in a supplier’s documentation — or need a partner who provides complete analytical packages as standard — get in touch. We can walk through what your specific program requires.

Learn how to read a pharmaceutical intermediate COA — assay vs. purity, red flags, and a checklist that catches what suppliers leave out.

GMP sets the baseline for pharmaceutical quality. cGMP demands you keep up with the times. Here’s what the difference means for buyers sourcing APIs and intermediates.

This guide covers the Orforglipron synthesis challenges, supply window, and what to demand from a qualified supplier.
Leading provider of high-quality APIs and intermediates. Contact us for innovative solutions and expert support.