The Quote That Made a Buyer Pause
A procurement manager recently showed us three quotes for the same pharmaceutical intermediate—same CAS number, same purity specification (≥99.0%), same delivery terms. The prices differed by 47% between the lowest and highest bid. His question was not “which one is cheapest?” It was “what am I actually paying for, and what am I not paying for?”
That question gets to the core of pharmaceutical intermediate pricing. The cost of a kilogram of intermediate is not a single number pulled from a catalog. It is the sum of six distinct cost layers, each with its own economics, and each influenced by decisions the manufacturer made long before your RFQ arrived.
Understanding these layers does not just help you compare quotes—it helps you identify which quote represents genuine manufacturing efficiency and which represents corners being cut.
This article walks through those six layers from the perspective of a manufacturer. We are not a trading company benchmarking market prices. We build cost from the plant floor up.
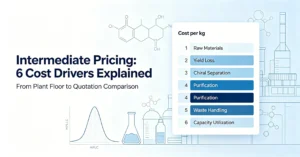
The Six Layers of Intermediate Cost Per Kilogram
The cost to produce one kilogram of a pharmaceutical intermediate can be understood as a stack of six interdependent layers. Each layer has its own drivers, its own variability range, and its own sensitivity to the manufacturer’s technical capabilities.
Layer 1: Starting Materials and the Petrochemical Index
For the majority of small-molecule intermediates, the cost chain begins with petrochemical feedstocks. Benzene, toluene, xylene, acetone, methanol—these are commodity chemicals whose prices track crude oil and natural gas markets. When Brent crude moves $10/barrel, the price of a substituted benzaldehyde derivative can shift 8-15% within 90 days.
This layer creates a structural pricing floor that no manufacturer can escape. What differentiates manufacturers is how exposed they are to this volatility:
- Supplier diversification.A manufacturer sourcing starting materials from three qualified suppliers across different provinces has a natural hedge against regional supply disruptions. One reliant on a single supplier accepts price volatility as a cost of convenience.
- Backward integration.Some manufacturers produce key starting materials in-house. If your intermediate requires a specific Grignard reagent that the manufacturer prepares from magnesium turnings and an aryl halide—rather than purchasing the preformed reagent at a premium—that integration removes one layer of supplier margin.
- Inventory strategy.Holding 3-6 months of safety stock on critical starting materials is expensive (working capital tied up in inventory), but it insulates against spot market spikes. The cost of that working capital is embedded in the per-kg price—and it buys supply assurance.
What this means for your quote: If Supplier A quotes 30% below Supplier B and both source the same CAS-numbered intermediate, ask about starting material origin. Supplier A may be using a lower-cost but less pure starting material—a decision that shifts cost downstream into purification (Layer 4).
📎For guidance on verifying raw material quality documentation, see our COA reading guide.
Layer 2: Synthesis Steps × Yield—The Exponential Multiplier
This is the single most powerful lever in intermediate cost, and the one least visible on a quote. A five-step synthesis where each step achieves 85% yield produces a total yield of 0.85⁵ = 44.4%. At 90% per step, total yield becomes 0.90⁵ = 59.0%—a 33% increase in output from the same quantity of starting material. At 80% per step? Total yield collapses to 32.8%.
Synthesis Steps | At 80% per step | At 85% per step | At 90% per step | At 95% per step |
3 steps | 51.2% | 61.4% | 72.9% | 85.7% |
5 steps | 32.8% | 44.4% | 59.0% | 77.4% |
7 steps | 21.0% | 32.0% | 47.8% | 69.8% |
10 steps | 10.7% | 19.7% | 34.9% | 59.9% |
The cost implication is direct: raw material consumption per kilogram of finished intermediate scales as 1/(total yield). A manufacturer operating at 85% per-step yield on a 5-step route consumes 2.25 kg of starting material equivalents per kg of product.
At 90%, that drops to 1.69 kg—a 25% reduction in raw material cost alone, before considering solvent, labor, and utility savings from handling less mass.
Yield differences between manufacturers are rarely about “bad chemistry.” They are about process development investment. A manufacturer who has spent 200 development hours optimizing quench pH, crystallization cooling rate, and phase separation time on each step will consistently outperform one who runs the literature procedure without modification.
That development cost is amortized over production batches—another cost embedded in the per-kg price that delivers lower total cost.
Layer 3: Chiral Chemistry and Separation Costs
If your intermediate contains one or more chiral centers, pricing becomes fundamentally different from an achiral molecule. The most common industrial approaches each carry distinct cost profiles:
Chiral Strategy | Relative Cost Factor | When It Makes Sense |
Achiral synthesis (no chiral center) | 1.0× (baseline) | Simple aromatic/heterocyclic intermediates |
Chiral pool starting material | 1.5-3× | Amino acid or carbohydrate-derived scaffolds |
Asymmetric catalysis | 2-5× (catalyst cost) but high ee | Critical stereocenters where ≥99% ee is required |
Classical resolution (diastereomeric salt) | 1.8-2.5× (50% theoretical yield cap) | When asymmetric routes are not viable; half of material is discarded |
Chiral chromatography (preparative SMB) | 3-8× at scale | Early development; rarely economical beyond kg scale |
Classical resolution deserves special attention because it is a common source of hidden cost. If a racemic intermediate is synthesized and then resolved via diastereomeric salt formation, the maximum theoretical yield of the desired enantiomer is 50%.
In practice, even with mother liquor recycling, the yield is typically 35-42%. This means 58-65% of the synthesized material is discarded—and the cost of synthesizing that discarded material is fully loaded into the price of the remaining product.
What this means for your quote: If your intermediate has a chiral center and the price seems surprisingly low, ask whether the manufacturer uses asymmetric synthesis or classical resolution. The latter may deliver a lower quote today but carries inherent supply risk: every batch is capped at ~40% yield, so capacity is effectively half of what the reactor volume suggests.
📎Our supplier audit checklist includes questions to verify a manufacturer’s chiral synthesis capabilities during on-site evaluation.
Layer 4: Purification—The Hidden 20-30%
When buyers specify “purity ≥99.0%,” they are making a cost decision whether they realize it or not. The cost to move from 97% to 99% purity is not a linear 2% increase—it can be 20-30% of total manufacturing cost, because the final purification step operates in a region of diminishing returns.
The purification method itself is a major cost differentiator:
Purification Method | Cost Relative to Crystallization | Best For | Cost Driver |
Recrystallization (single solvent) | 1.0× (baseline) | Crystalline solids with good solubility differential | Solvent volume, cooling energy, yield loss to mother liquor |
Recrystallization (binary solvent system) | 1.3-1.8× | Compounds requiring precise polarity tuning | Second solvent cost, solvent recovery complexity, longer cycle time |
Slurry purification / Trituration | 0.6-0.9× | Removing surface impurities; borderline purity targets | Lower solvent volume, but may require multiple cycles |
Flash chromatography | 5-15× | Lab to multi-kg; structurally similar impurities | Silica gel, solvent volume, labor, waste disposal of spent silica |
Preparative HPLC | 8-20× | High-value, low-volume intermediates | Acetonitrile/methanol consumption, column replacement, low throughput |
Distillation / Fractional distillation | 0.5-0.8× | Volatile liquid intermediates | Energy (heating + condensation), vacuum system |
A manufacturer that has developed a robust crystallization protocol—one that reliably delivers ≥99.5% purity in a single recrystallization from a recoverable Class 3 solvent—has fundamentally lower cost structure than one relying on chromatographic polishing.
This development work is invisible to the buyer but directly visible in the quoted price.
Layer 5: Waste Treatment and Environmental Compliance
For every kilogram of pharmaceutical intermediate produced, approximately 25-100 kg of waste is generated—wastewater, spent solvents, spent silica or activated carbon, aqueous layers from workup, and filter cakes.
In China, industrial hazardous waste disposal costs have risen sharply over the past five years, from approximately ¥2,000-3,000/ton in 2018 to ¥4,000-8,000/ton in 2026 for Class I hazardous waste, depending on the province and the waste profile.
This creates a powerful cost asymmetry between manufacturers with different approaches:
- End-of-pipe treatment(treat waste after it is generated): The manufacturer pays disposal fees on every kilogram of waste. This is the default approach for facilities without solvent recovery infrastructure.
- Solvent recovery and recycling: A manufacturer that distills and reuses reaction solvents (THF, ethyl acetate, toluene, methanol) can reduce fresh solvent purchases by 60-85% and simultaneously reduce hazardous waste disposal volume. The capital cost of a solvent recovery system (distillation columns, storage tanks, analytical capability to verify recovered solvent quality) is significant—but once installed, the per-batch savings are equally significant.
- Process intensification(reduce waste at the source): Higher-concentration reactions, telescoped steps without intermediate isolation, and catalytic rather than stoichiometric reagents all reduce the mass of waste generated per kg of product.
What this means for your quote: A manufacturer operating a solvent recovery system may quote 12-18% lower than a competitor of equal scale without one—not because they are cutting corners, but because their waste costs are structurally lower. This is a genuine efficiency difference, not a quality compromise.
📎For a structured framework to evaluate suppliers beyond price, use our 30-point supplier audit checklist covering quality systems, production capability, and environmental compliance.
Layer 6: Scale, Capacity Utilization, and Overhead Allocation
The same intermediate produced at 10 kg scale and 500 kg scale can differ in unit cost by 40-60%. This is the economy of scale—not a discount for buying more, but a genuine change in cost structure:
- Fixed cost dilution:Batch documentation, analytical testing per batch (HPLC, GC, KF, ROI, residue on ignition), equipment cleaning, and line clearance are essentially fixed per batch regardless of batch size. A 500 kg batch spreads these costs over 50× more product than a 10 kg batch.
- Bulk procurement:Starting materials purchased in multi-ton quantities typically carry 15-30% lower unit prices than drum-quantity purchases.
- Dedicated equipment:When a manufacturer can dedicate a reactor train to a single product, they eliminate changeover cleaning time, cross-contamination risk assessment, and the analytical burden of verifying cleaning effectiveness between campaigns. This is only viable at sustained commercial volumes.
Capacity utilization adds another dimension. A manufacturer running at 85% capacity utilization has fundamentally different overhead allocation than one at 50%.
The building depreciation, QC lab overhead, utilities infrastructure, and EHS staff costs are the same whether the plant is running or idle. At low utilization, these fixed costs are spread over fewer kilograms, inflating the per-kg price.
What this means for your quote: A small price difference (5-10%) between two qualified manufacturers at similar scale may simply reflect different capacity utilization. A large difference (>30%) at similar quoted scale merits deeper investigation—the lower quote may reflect a manufacturer who has not properly costed their overhead, quality systems, or environmental compliance.
How to Evaluate Competing Quotes: A Buyer’s Decision Framework
Armed with an understanding of the six cost layers, you can move beyond comparing numbers to comparing value. Here is a structured approach:
Evaluation Question | Cost Layer | What a Strong Answer Sounds Like |
What is the country of origin for key starting materials? | Layer 1 | “We source [material X] from three qualified suppliers; the current batch used material from [supplier] with purity ≥99.0%.” |
What is the total yield across the synthesis, and what are the per-step yields? | Layer 2 | “Total yield is 52% over five steps (90%, 85%, 82%, 91%, 88%). Step 3 is the yield-limiting step due to [reason].” |
How are chiral centers controlled? | Layer 3 | “We use asymmetric hydrogenation with a Ru-BINAP catalyst, achieving ≥99% ee consistently across 12 validation batches.” |
What is the final purification method? | Layer 4 | “Single recrystallization from ethanol/water (3:1 v/v), delivering ≥99.5% purity with <0.1% any single impurity.” |
What is your solvent recovery rate for this product? | Layer 5 | “We recover and reuse THF at >80%; recovered solvent is GC-verified for purity and water content before reuse.” |
What is your current production capacity and utilization rate for this product? | Layer 6 | “We have dedicated capacity of 200 kg/month for this intermediate and are currently at ~70% utilization.” |
You do not need to ask all six questions for every quote. Target the layers most relevant to your intermediate’s structure: a chiral intermediate demands Layer 3; a multi-step synthesis demands Layer 2; a specification calling for ≥99.5% purity demands Layer 4.
Red Flags That Signal Hidden Costs
Experience has shown us that certain patterns in pricing and communication reliably predict downstream problems:
- The quote that is 35%+ below the market median without explanation.The cost floor for pharmaceutical intermediates is set by starting material cost plus minimum unavoidable processing costs. A quote significantly below this floor cannot reflect compliant manufacturing. If the number seems too good to be true, ask the six questions above—and watch the response carefully.
- The supplier who cannot provide per-step yield data.Every competent manufacturer tracks per-step yields as a basic process control metric. A supplier who cannot or will not share these numbers either does not track them (a quality system red flag) or does not want you to see them (a cost transparency red flag).
- The quote that does not change with order quantity.If a supplier quotes the same per-kg price for 10 kg and 100 kg, they are either already operating at minimum efficient scale (unlikely for a 10 kg order) or they have not actually costed the difference. Fixed batch costs do not scale linearly—a price that does not reflect this is a price that has not been calculated.
- The purity specification that says “≥99%” with no impurity profile.“≥99%” without a defined impurity profile is a meaningless number. A 99% purity with 0.8% of a single unidentified impurity at RRT 1.15 is a fundamentally different product from 99% purity with ten identified impurities each below 0.1%. Demand the full HPLC chromatogram, not just the area-% number.
Frequently Asked Questions
Why do prices for the same intermediate vary so much between Chinese manufacturers?
Price variation between manufacturers producing the same CAS-numbered intermediate typically reflects differences in synthesis route (number of steps, starting material grade), per-step yields, purification method, solvent recovery capability, and environmental compliance investment.
Two manufacturers using different synthetic routes to the same molecule can have fundamentally different cost structures. A manufacturer with solvent recovery and wastewater treatment infrastructure will have lower waste disposal costs than one paying external treatment fees. These are genuine operational differences, not arbitrary markup.
Is a lower price always a sign of lower quality?
Not necessarily. A lower price can reflect genuine manufacturing efficiency—higher per-step yields, solvent recovery, backward integration into key starting materials, or higher capacity utilization. The key is to determine why the price is lower.
Ask about the specific cost drivers: total yield, purification method, starting material source, and solvent recovery rate. A manufacturer who can explain their cost advantage in concrete process terms is likely delivering genuine efficiency. One who cannot—or deflects to generic claims about “competitive pricing”—may be cutting corners that will surface as quality issues later.
How much does order quantity affect the per-kg price?
For most pharmaceutical intermediates, moving from 10 kg to 100 kg order quantity typically reduces per-kg cost by 25-40%, and from 100 kg to 500 kg by an additional 10-20%.
These reductions come from three sources: dilution of fixed batch costs (QC testing, documentation, equipment cleaning) over more kilograms; bulk procurement discounts on starting materials and solvents; and more efficient equipment utilization. Beyond approximately 1,000 kg per campaign, additional scale economies diminish—the process has reached its minimum efficient scale given the reactor train size.
What is the single biggest cost driver most buyers overlook?
Purification method. Buyers routinely specify “purity ≥99.0%” without understanding whether the manufacturer achieves this through a simple recrystallization or preparative HPLC.
The cost difference can be 5-15× for the final purification step alone. When specifying purity requirements, ask the manufacturer what purification method they use and whether a slightly lower purity target (e.g., 98.5% vs 99.0%) would allow a simpler, more economical purification approach.
In many cases, the downstream API synthesis step can tolerate 98.5% purity with a defined impurity profile just as well as 99.0%—and the cost savings can be significant.
How should I compare quotes from manufacturers using different synthetic routes?
Different synthetic routes to the same intermediate are common, especially for complex molecules. When comparing such quotes, focus on three factors beyond the per-kg price: (1) The impurity profile—different routes generate different impurity suites, and one route’s impurities may be harder to purge in downstream steps; (2) Scalability—a route demonstrated at 500 kg scale carries less risk than one only run at lab scale; (3) Supply security—a route dependent on a single-supplier chiral catalyst introduces a different risk profile than one using commodity reagents. The lowest-quote route is not necessarily the best-value route once these factors are considered.
Does the manufacturer’s location within China affect pricing?
Yes, meaningfully. Manufacturing costs in China vary by province based on several factors: industrial electricity prices (ranging from approximately ¥0.45-0.85/kWh depending on province and time-of-day tariff), steam/thermal energy costs, wastewater treatment fees, labor availability and wages, and local environmental enforcement intensity.
Coastal provinces (Jiangsu, Zhejiang, Shandong) generally have higher operating costs but better logistics infrastructure and a deeper pool of experienced chemical operators. Inland provinces may offer lower operating costs but can face longer shipping lead times and fewer ancillary services. A price difference of 5-15% between coastal and inland manufacturers for the same intermediate is normal and reflects these structural cost differences.
Conclusion
The price on a quotation is the last line of a story that began with the choice of starting material, ran through the synthesis route and its yields, accumulated cost at each purification step, added the burden of waste treatment, and was finally divided by the number of kilograms in the batch. Understanding that story does not just make you a better negotiator—it makes you a more informed sourcing decision-maker.
The goal is not to find the lowest price. It is to find the price that accurately reflects compliant, efficient, and sustainable manufacturing. When you understand the six layers, you can tell the difference.
About the author: Tianming Pharm is a China-based manufacturer of pharmaceutical intermediates and APIs. This analysis is based on our experience managing production costs across a portfolio of intermediate and API products. For specific pricing inquiries related to your target molecule, contact our technical team with your CAS number and purity requirements.